Hilfe
Hilfe
 Neues Thema


Ich schmökere schon seit Längerem hier und habe auch schon auf zahlreiche Fragen Antworten gefunden. An dieser Stelle mal pauschal ein riesiges DANKE an alle Beteiligten

Nun bin ich aber auf ein Problem gestoßen, dass mich an meine bescheidenen Google- und Forengrenzen bringt.
Seit einiger Zeit (ein paar Monaten) quält mich folgendes Problem:
- Alle paar Nasenlängen (Intervall variiert zwischen 30 Minuten und 5 Tagen) habe ich entweder einen amüsanten BSOD oder das System friert komplett ein (auch Sound). Und das dann mehrmals hintereinander.
- Ab und zu passiert es dann, dass ich beim Neustart nicht mal zum Bios komme (Lüfter laufen auf Hochtouren, aber Nichts am Screen). Nach 1, 2 mal Rebooten komme ich dann wieder ins OS.
- Passiert meistens, wenn ich eine Applikation starte (Bisher: Ad Aware, Warhammer 40k Dawn of War II, Call Of Duty 5, VLC Media Player, Media Player)
- Wenn ich formatiere und neu Aufsetze (bisher 3 mal), rennt das Ding eine Zeit lang einwandfrei, beginnt dann aber wieder mit dem Gezicke (ca. 10 Stunden netto betrieben)
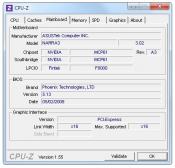
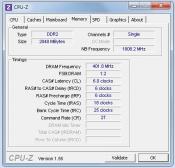
- Mein System:
HP Pavilion m9190.de
4GB DDR2
AMD Phenom QC (4x 2.2GHz)
GeForce 8800GT
Asus Narra3 Mainboard (nForce 430)
Netgear WG311 WLAN USB Stick
Soundblaster X-FI Audio Extrem
Anbei auch der letztgültige Crashdump, den mein System ausgekotzt hat.
Würde mich SEHR über konstruktives Feedback freuen

Vielen lieben Dank im Voraus!
cheers,
Stef
CODE
Microsoft ® Windows Debugger Version 6.12.0002.633 AMD64
Copyright © Microsoft Corporation. All rights reserved.
Loading Dump File [C:WindowsMinidump\072810-22401-01.dmp]
Mini Kernel Dump File: Only registers and stack trace are available
Symbol search path is: srv*c:cache*http://msdl.microsoft.com/download/symbols
Executable search path is:
Windows 7 Kernel Version 7600 MP (4 procs) Free x64
Product: WinNt, suite: TerminalServer SingleUserTS
Built by: 7600.16385.amd64fre.win7_rtm.090713-1255
Machine Name:
Kernel base = 0xfffff800`02807000 PsLoadedModuleList = 0xfffff800`02a44e50
Debug session time: Tue Jul 27 23:06:37.804 2010 (UTC + 2:00)
System Uptime: 0 days 1:40:36.832
Loading Kernel Symbols
..................................................
....WARNING: vga overlaps Beep
....WARNING: rdpencdd overlaps RDPCDD
.WARNING: rdprefmp overlaps rdpencdd
.WARNING: Msfs overlaps rdprefmp
.WARNING: Npfs overlaps Msfs
..
WARNING: TDI overlaps tdx
...WARNING: afd overlaps PctWfpFilter64
..WARNING: wfplwf overlaps netbt
.WARNING: pacer overlaps wfplwf
..WARNING: wanarp overlaps netbios
.....WARNING: discache overlaps mssmbios
...WARNING: blbdrive overlaps dfsc
.............WARNING: CompositeBus overlaps dxgmms1
.WARNING: AgileVpn overlaps dxgkrnl
....WARNING: raspppog overlaps ndiswan_sys
.WARNING: raspptp_sys overlaps raspppog
....WARNING: mouclass overlaps kbdclass
..WARNING: swenum overlaps AgileVpn
...WARNING: umbus overlaps usbehci
........WARNING: usbccgp overlaps cdfs
.......WARNING: LUsbFilt overlaps Dxapi
..WARNING: HIDCLASS overlaps hidusb
.WARNING: HIDPARSG overlaps HIDCLASS
..
.WARNING: LHidFilt overlaps monitor
.....WARNING: crashdmp overlaps kbdhid
......WARNING: hidir overlaps dump_duopfve
.WARNING: USBSTOR_SYS overlaps usbcir
...WARNING: lltdio overlaps luafv
WARNING: lltdio overlaps pctgntdi64
...WARNING: rspndr overlaps ndisuio
.WARNING: HTTP overlaps rspndr
.WARNING: bowser overlaps HTTP
.......WARNING: srvnet overlaps secdrv
.WARNING: tcpipreg overlaps srvnet
.WARNING: srv2 overlaps tcpipreg
..WARNING: LVPr2M64 overlaps srv
...WARNING: pctplfw64 overlaps pctNdis_PacketFilter64
Loading User Symbols
Loading unloaded module list
...........
**************************************************
*****************************
* *
* Bugcheck Analysis *
* *
**************************************************
*****************************
Use !analyze -v to get detailed debugging information.
BugCheck A, {0, 2, 1, fffff8000287edd8}
Probably caused by : hardware ( nt!KiSwapContext+78 )
Followup: MachineOwner
---------
2: kd> !analyze -v
**************************************************
*****************************
* *
* Bugcheck Analysis *
* *
**************************************************
*****************************
IRQL_NOT_LESS_OR_EQUAL (a)
An attempt was made to access a pageable (or completely invalid) address at an
interrupt request level (IRQL) that is too high. This is usually
caused by drivers using improper addresses.
If a kernel debugger is available get the stack backtrace.
Arguments:
Arg1: 0000000000000000, memory referenced
Arg2: 0000000000000002, IRQL
Arg3: 0000000000000001, bitfield :
bit 0 : value 0 = read operation, 1 = write operation
bit 3 : value 0 = not an execute operation, 1 = execute operation (only on chips which support this level of status)
Arg4: fffff8000287edd8, address which referenced memory
Debugging Details:
------------------
WRITE_ADDRESS: GetPointerFromAddress: unable to read from fffff80002aaf0e0
0000000000000000
CURRENT_IRQL: 2
FAULTING_IP:
nt!KiSwapContext+78
fffff800`0287edd8 0000 add byte ptr [rax],al
CUSTOMER_CRASH_COUNT: 1
DEFAULT_BUCKET_ID: VISTA_DRIVER_FAULT
BUGCHECK_STR: 0xA
PROCESS_NAME: System
TRAP_FRAME: fffff880033ab8a0 -- (.trap 0xfffff880033ab8a0)
NOTE: The trap frame does not contain all registers.
Some register values may be zeroed or incorrect.
rax=0000000000000000 rbx=0000000000000000 rcx=0000000000000001
rdx=00000a6800000000 rsi=0000000000000000 rdi=0000000000000000
rip=fffff8000287edd8 rsp=fffff880033aba30 rbp=fffffa8002507b60
r8=0000000000000000 r9=000000000020ef34 r10=00000000000151a3
r11=fffff88003163100 r12=0000000000000000 r13=0000000000000000
r14=0000000000000000 r15=0000000000000000
iopl=0 nv up ei ng nz na po nc
nt!KiSwapContext+0x78:
fffff800`0287edd8 0000 add byte ptr [rax],al ds:00000000`00000000=?
Resetting default scope
MISALIGNED_IP:
nt!KiSwapContext+78
fffff800`0287edd8 0000 add byte ptr [rax],al
LAST_CONTROL_TRANSFER: from fffff80002878469 to fffff80002878f00
STACK_TEXT:
fffff880`033ab758 fffff800`02878469 : 00000000`0000000a 00000000`00000000 00000000`00000002 00000000`00000001 : nt!KeBugCheckEx
fffff880`033ab760 fffff800`028770e0 : 00000000`00000000 fffff880`03163180 fffffa80`056e7300 fffff880`01841b15 : nt!KiBugCheckDispatch+0x69
fffff880`033ab8a0 fffff800`0287edd8 : fffffa80`024e0000 fffffa80`024e0000 00000000`00000140 fffff880`0f3fb504 : nt!KiPageFault+0x260
fffff880`033aba30 fffff800`02880052 : 00000000`00000001 fffffa80`02507b62 fffff800`00000000 00000000`00000000 : nt!KiSwapContext+0x78
fffff880`033abb70 fffff800`02883ac3 : fffffa80`02507b60 00000000`00000000 0000057d`00000000 0000057e`02c84328 : nt!KiCommitThreadWait+0x1d2
fffff880`033abc00 fffff800`0288613b : fffff800`02a1c500 fffff800`02b72504 fffffa80`02507b60 00000000`00000000 : nt!KeRemoveQueueEx+0x303
fffff880`033abcb0 fffff800`02b1c164 : 00000000`00000000 fffffa80`02507b62 00000000`00000080 fffffa80`024d9230 : nt!ExpWorkerThread+0xeb
fffff880`033abd40 fffff800`02857484 : fffff880`03163180 fffffa80`02507b60 fffff880`0316dfc0 00000000`00000000 : nt!PspSystemThreadStartup+0x58
fffff880`033abd80 00000000`00000000 : fffff880`033ac000 fffff880`033a6000 fffff880`033ab9f0 00000000`00000000 : nt!KxStartSystemThread+0x14
STACK_COMMAND: kb
FOLLOWUP_IP:
nt!KiSwapContext+78
fffff800`0287edd8 0000 add byte ptr [rax],al
SYMBOL_STACK_INDEX: 3
SYMBOL_NAME: nt!KiSwapContext+78
FOLLOWUP_NAME: MachineOwner
IMAGE_NAME: hardware
DEBUG_FLR_IMAGE_TIMESTAMP: 0
MODULE_NAME: hardware
FAILURE_BUCKET_ID: X64_IP_MISALIGNED
BUCKET_ID: X64_IP_MISALIGNED
Followup: MachineOwner
---------
2: kd> !analyze -v
**************************************************
*****************************
* *
* Bugcheck Analysis *
* *
**************************************************
*****************************
IRQL_NOT_LESS_OR_EQUAL (a)
An attempt was made to access a pageable (or completely invalid) address at an
interrupt request level (IRQL) that is too high. This is usually
caused by drivers using improper addresses.
If a kernel debugger is available get the stack backtrace.
Arguments:
Arg1: 0000000000000000, memory referenced
Arg2: 0000000000000002, IRQL
Arg3: 0000000000000001, bitfield :
bit 0 : value 0 = read operation, 1 = write operation
bit 3 : value 0 = not an execute operation, 1 = execute operation (only on chips which support this level of status)
Arg4: fffff8000287edd8, address which referenced memory
Debugging Details:
------------------
WRITE_ADDRESS: 0000000000000000
CURRENT_IRQL: 2
FAULTING_IP:
nt!KiSwapContext+78
fffff800`0287edd8 0000 add byte ptr [rax],al
CUSTOMER_CRASH_COUNT: 1
DEFAULT_BUCKET_ID: VISTA_DRIVER_FAULT
BUGCHECK_STR: 0xA
PROCESS_NAME: System
TRAP_FRAME: fffff880033ab8a0 -- (.trap 0xfffff880033ab8a0)
NOTE: The trap frame does not contain all registers.
Some register values may be zeroed or incorrect.
rax=0000000000000000 rbx=0000000000000000 rcx=0000000000000001
rdx=00000a6800000000 rsi=0000000000000000 rdi=0000000000000000
rip=fffff8000287edd8 rsp=fffff880033aba30 rbp=fffffa8002507b60
r8=0000000000000000 r9=000000000020ef34 r10=00000000000151a3
r11=fffff88003163100 r12=0000000000000000 r13=0000000000000000
r14=0000000000000000 r15=0000000000000000
iopl=0 nv up ei ng nz na po nc
nt!KiSwapContext+0x78:
fffff800`0287edd8 0000 add byte ptr [rax],al ds:00000000`00000000=?
Resetting default scope
MISALIGNED_IP:
nt!KiSwapContext+78
fffff800`0287edd8 0000 add byte ptr [rax],al
LAST_CONTROL_TRANSFER: from fffff80002878469 to fffff80002878f00
STACK_TEXT:
fffff880`033ab758 fffff800`02878469 : 00000000`0000000a 00000000`00000000 00000000`00000002 00000000`00000001 : nt!KeBugCheckEx
fffff880`033ab760 fffff800`028770e0 : 00000000`00000000 fffff880`03163180 fffffa80`056e7300 fffff880`01841b15 : nt!KiBugCheckDispatch+0x69
fffff880`033ab8a0 fffff800`0287edd8 : fffffa80`024e0000 fffffa80`024e0000 00000000`00000140 fffff880`0f3fb504 : nt!KiPageFault+0x260
fffff880`033aba30 fffff800`02880052 : 00000000`00000001 fffffa80`02507b62 fffff800`00000000 00000000`00000000 : nt!KiSwapContext+0x78
fffff880`033abb70 fffff800`02883ac3 : fffffa80`02507b60 00000000`00000000 0000057d`00000000 0000057e`02c84328 : nt!KiCommitThreadWait+0x1d2
fffff880`033abc00 fffff800`0288613b : fffff800`02a1c500 fffff800`02b72504 fffffa80`02507b60 00000000`00000000 : nt!KeRemoveQueueEx+0x303
fffff880`033abcb0 fffff800`02b1c164 : 00000000`00000000 fffffa80`02507b62 00000000`00000080 fffffa80`024d9230 : nt!ExpWorkerThread+0xeb
fffff880`033abd40 fffff800`02857484 : fffff880`03163180 fffffa80`02507b60 fffff880`0316dfc0 00000000`00000000 : nt!PspSystemThreadStartup+0x58
fffff880`033abd80 00000000`00000000 : fffff880`033ac000 fffff880`033a6000 fffff880`033ab9f0 00000000`00000000 : nt!KxStartSystemThread+0x14
STACK_COMMAND: kb
FOLLOWUP_IP:
nt!KiSwapContext+78
fffff800`0287edd8 0000 add byte ptr [rax],al
SYMBOL_STACK_INDEX: 3
SYMBOL_NAME: nt!KiSwapContext+78
FOLLOWUP_NAME: MachineOwner
IMAGE_NAME: hardware
DEBUG_FLR_IMAGE_TIMESTAMP: 0
MODULE_NAME: hardware
FAILURE_BUCKET_ID: X64_IP_MISALIGNED
BUCKET_ID: X64_IP_MISALIGNED
Followup: MachineOwner
---------
achja,
Ich hab' Windows 7 Ultimate 64 Bit laufen

Nur als keine Randinfo.
cheers,
Dieser Beitrag wurde von Lordgoofy bearbeitet: 28. Juli 2010 - 19:28
Änderungsgrund: shrink and merge